


Most lifecycle teams pull the same ESP data the same way every week, and that cycle repeated over and over begins to quietly eat up precious time. By the time the writeup lands in Slack, the insight is already stale.
Mary Aguililla, Lifecycle Marketing Manager at Hatch, built a Claude skill that does the pull, the relative lift math, and the writeup in one pass, and she was kind enough to share what she built and how she uses it. With that, I'll let her take it from here:
The problem: same pull, calculate, format cycle
" Every time I needed to evaluate a campaign, I was doing the same thing: pulling data from Braze, editting a spreadsheet, calculating relative lifts, and then writing up the findings in a format stakeholders could actually scan. The analysis itself wasn't hard, but the pull-calculate-format cycle was eating 45 minutes to an hour every time, and I was doing it multiple times a month. Not only was it time consuming, but I had a nagging feeling I was missing trends overtime or other insights that could influence our work.
Campaign analysis in minutes instead of an hour
" The skill connects directly to the Braze MCP, pulls campaign or canvas data (it searches both automatically since Braze users know the naming can be inconsistent), calculates relative lift, and frames results with the business implication first (not just the numbers). It outputs a structured analysis with a Slack-ready summary format, so you go from "I need to check how that campaign did" to a shareable writeup in one pass. The part that's genuinely hard to replicate quickly is the built-in analysis principles (e.g. it catches common mistakes like dismissing small-sample lifts or dramatizing zero conversions when the real issue is upstream volume). As you use it, there is space in the skill to update it specifically to your business and program needs so the skill gets smarter run after run.
Running a real subscription A/B test
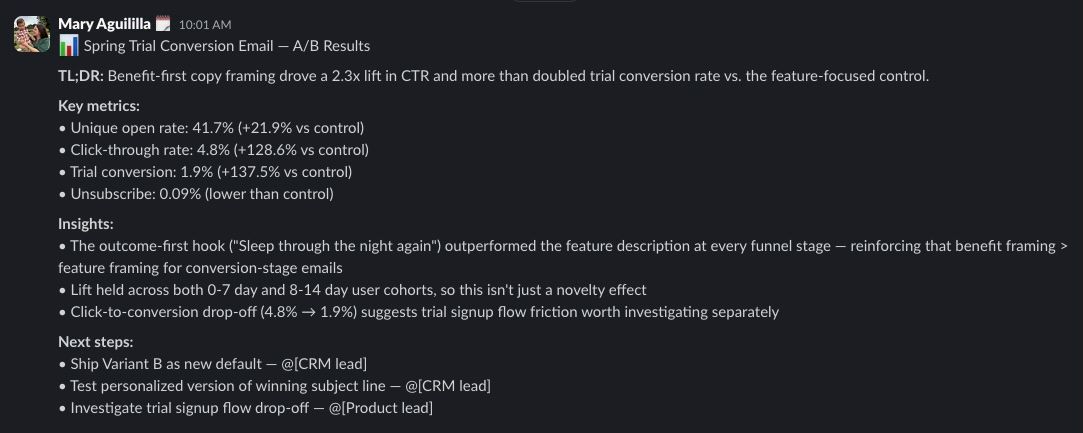
" I was looking at an A/B test on a subscription conversion flow with two creative variants. The skill pulled the canvas data, broke down performance by variant with relative lift calculations, and flagged that one variant had a 2x lift on click-through despite a small sample. Instead of dismissing it (which honestly I might have done eyeballing a spreadsheet), the analysis led with the relative impact and caveated the sample size after. That framing helped me make the case to extend the test rather than kill it, and the winning variant held up at scale.
What you need before you start
" This requires the Braze MCP server connected to your Braze instance. You'll want to customize the benchmark tables with your own historical data. The skill ships with empty benchmarks so you're not accidentally comparing against someone else's numbers. Works best when you've already defined your campaign's primary success metric before running the analysis.
The bottom line
The interesting move in Mary's writeup isn't the time saved, it's the part where she extended an A/B test she might have killed. Most lifecycle teams kill small-sample tests on instinct and lose the signal underneath. Building relative lift framing into the readout itself changes which tests get a second look.
" Before this, campaign readouts were a time sink that I'd sometimes delay or felt rushed doing (which meant insights got stale or got buried in a spreadsheet). Now the analysis happens same-day, the framing is consistent, and the output is ready to share in Slack without reformatting. My team actually reads the readouts now because they lead with "so what" instead of raw numbers. The relative lift framing has also changed how we talk about tests, we're more willing to let small-sample tests run because we're looking at the signal, not just the volume.